

New features in X2C Scope
Freeze a waveform, watch it glow, mark peaks, read out every channel at once, measure with cursors, get automatic measurements, compute math channels – and take the results with you as images or scripts. All live on your target, right next to your model.
Eight new tools, one toolbar
Every new function sits one click away in the Scope toolbar. Toolbar buttons with options carry a right-click settings menu, so you configure them right where you use them.
Freeze
Hold the current data set as a reference while sampling continues.
Afterglow
Phosphor-like persistence of the last data sets reveals jitter and noise.
Marker
Click a trace to pin its exact value and time on the plot.
Multi Cursor
Read every channel at the mouse position – at one glance.
H & V Cursors
Two vertical and two horizontal cursors with Δ and Δ/Δt read-outs.
Measure
Min, Max, Pk-Pk, Mean, RMS, Std Dev, Frequency, Period and Duty.
Math
Add, subtract, multiply, divide, integrate or differentiate channels.
Plot Image & Export
One-click images and Matlab / Scilab scripts with automatic file naming.
Freeze
Caught the waveform you were waiting for? Freeze it. The currently displayed data set stays on the plot as a reference, while new samples keep coming in on top of it.
- Compare before / after while tuning controller parameters live
- Spot drift and deviations against a known-good response
- Release the frozen data set with a second click
Example: Step response of a biquad low-pass filter – input in purple, output in orange.

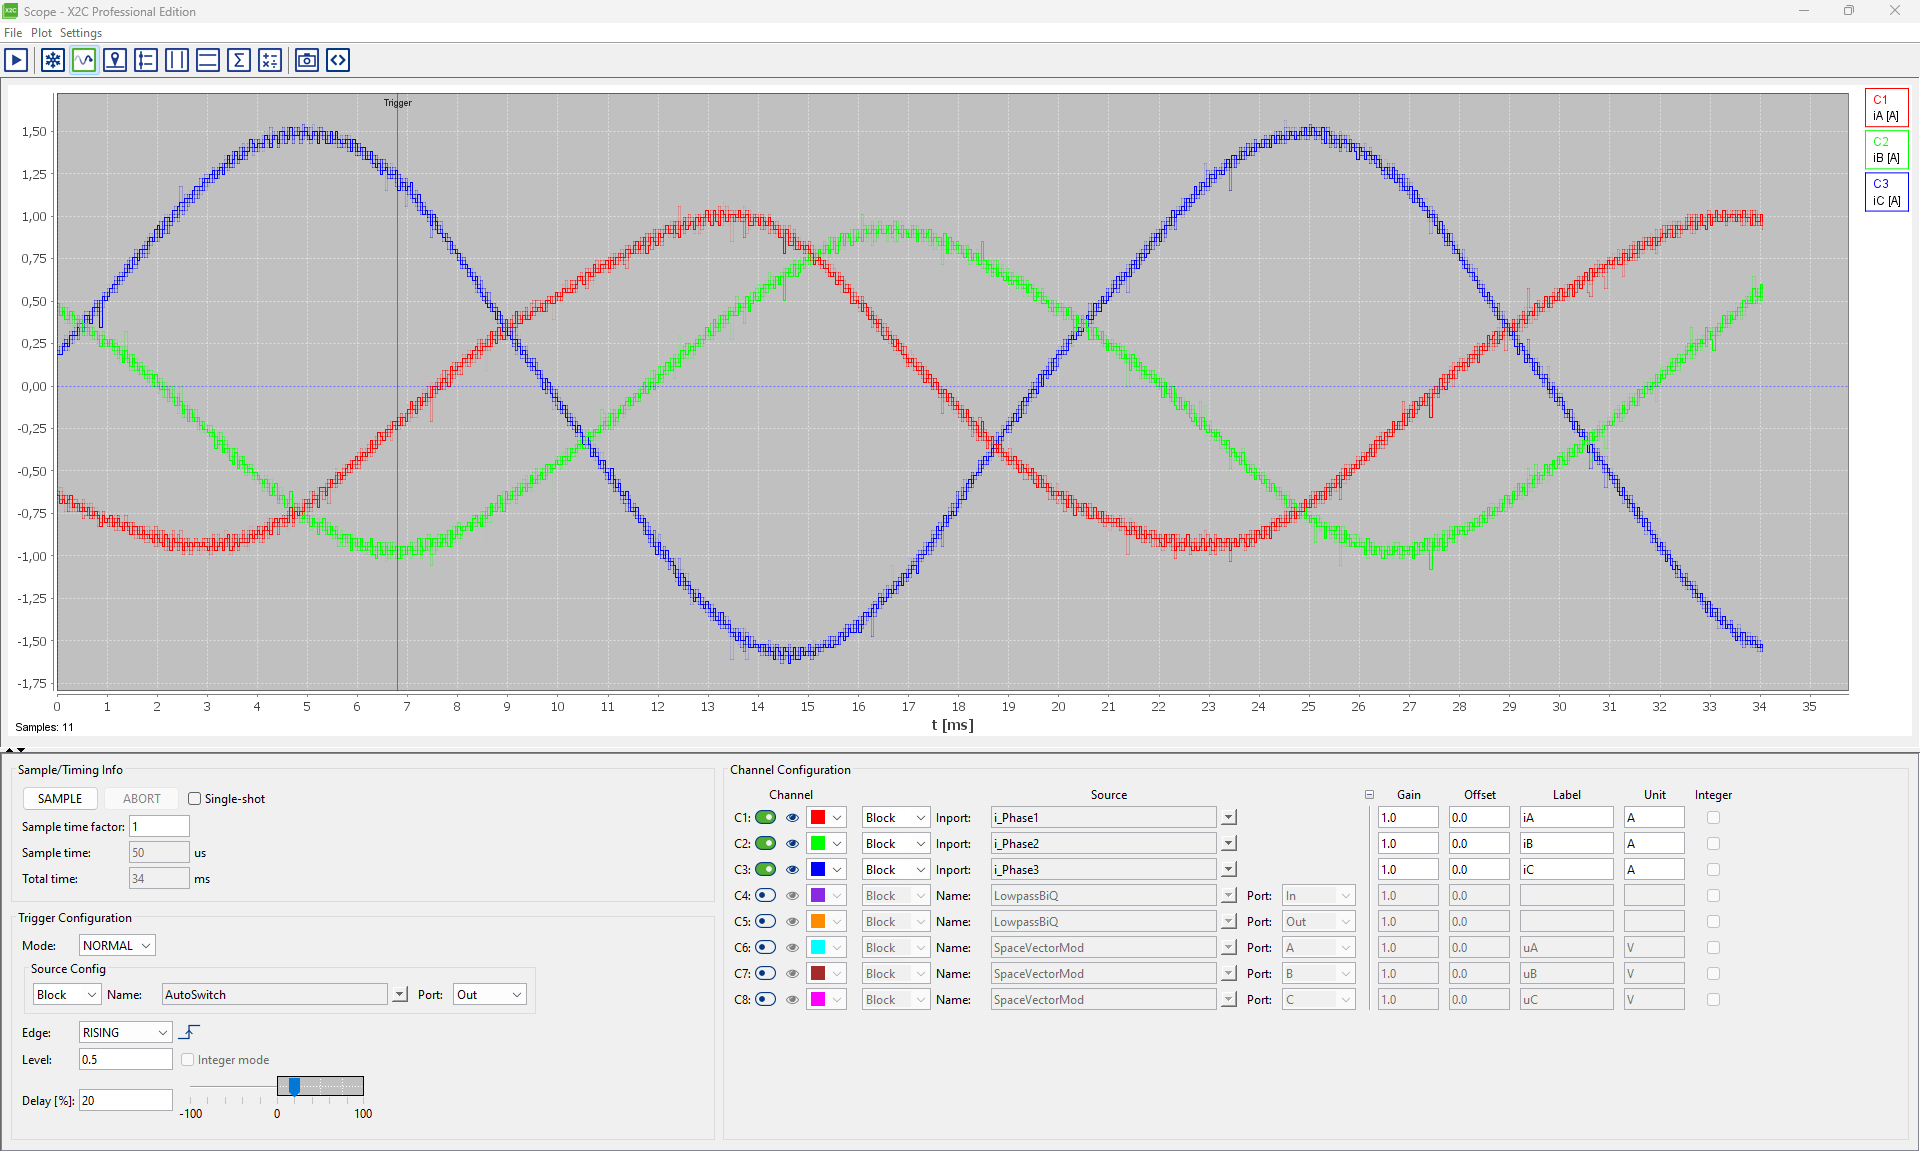
Afterglow
Just like the phosphor of a classic analog scope: previous data sets fade out gradually behind the current one. Noise, jitter and sporadic outliers become visible at a glance.
- Keep from 1 up to 50 faded data sets (default: 8)
- Number of data sets configurable via right-click on the toolbar button
- Ideal for judging current ripple and measurement noise
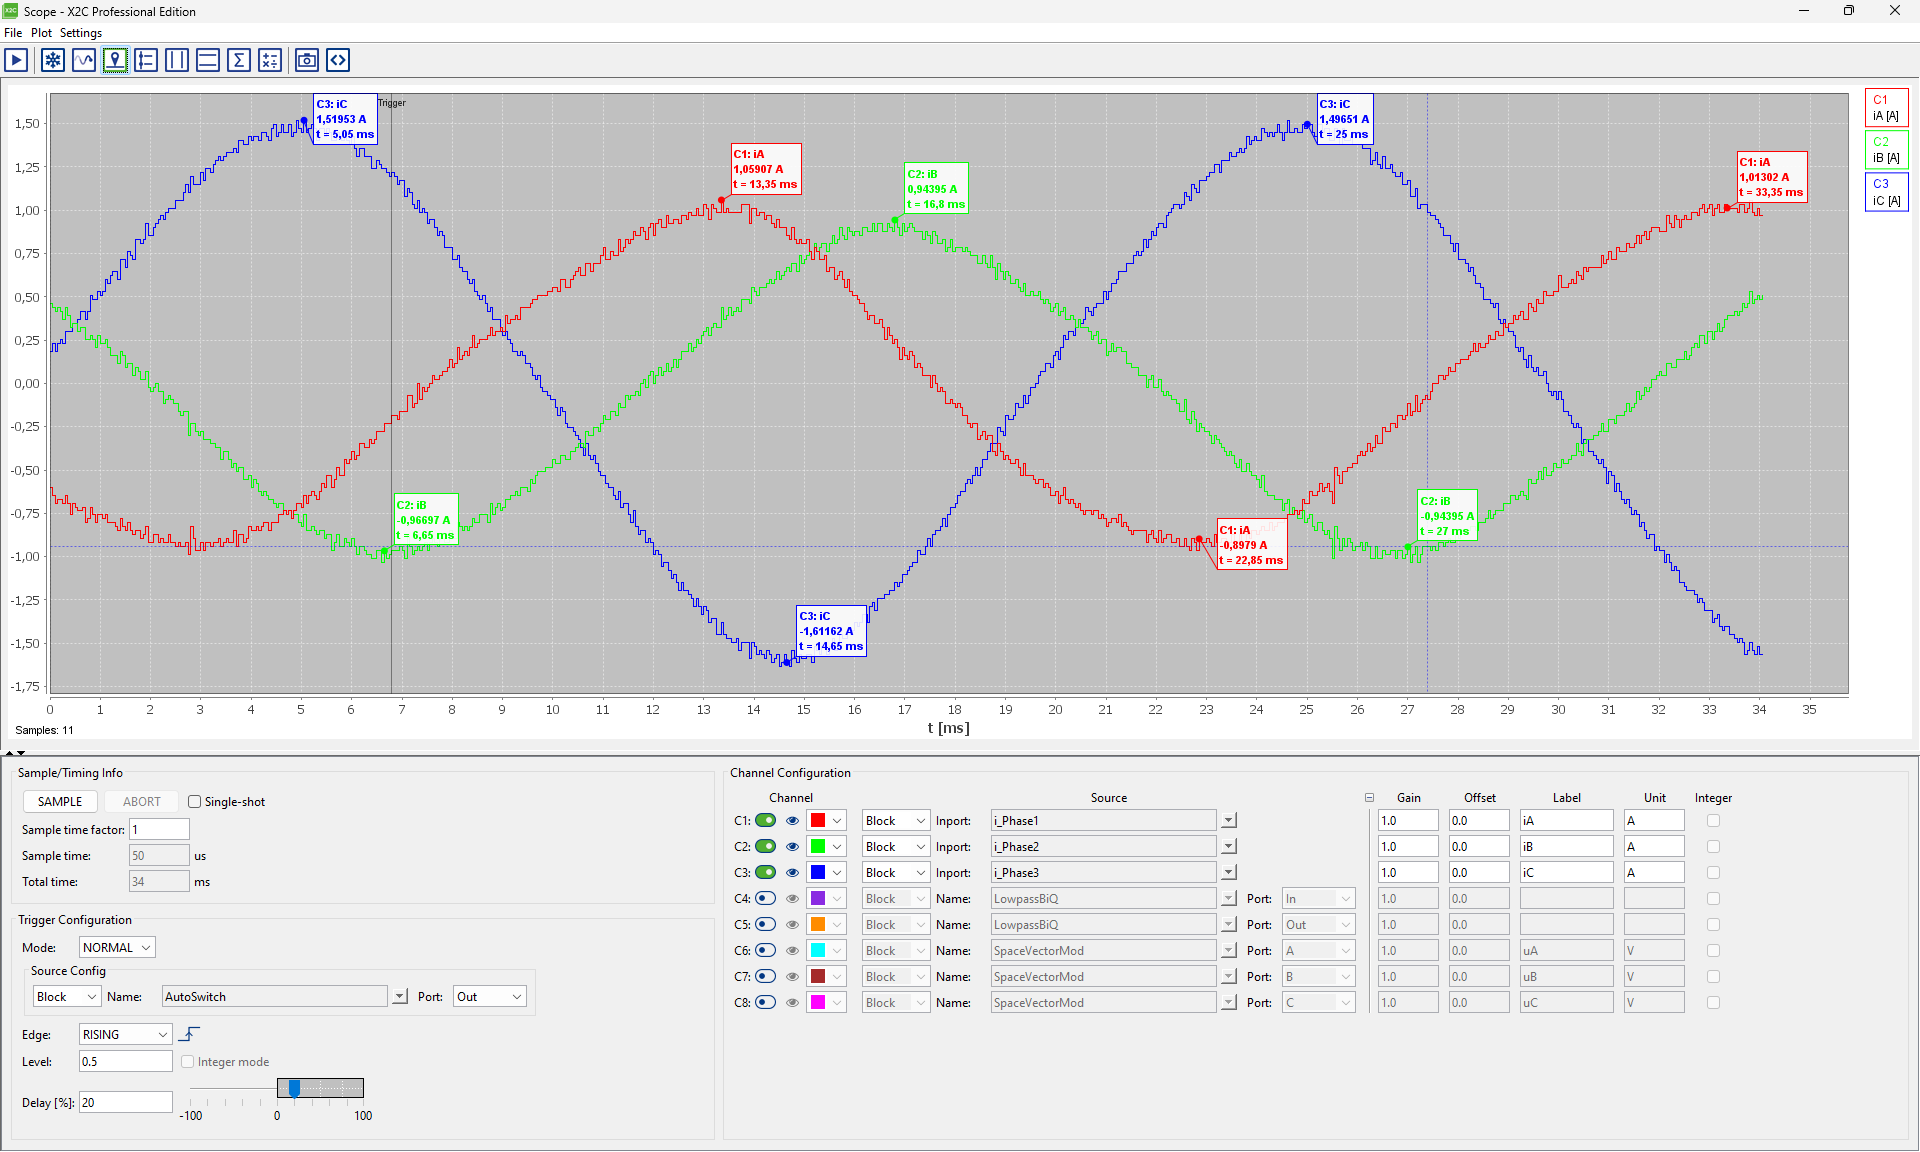
Marker
Click on a trace to place a marker. It snaps to the nearest sample and shows channel, value with unit and time – in the color of its channel.
- Place as many markers as you need, on any channel
- Click a marker again to remove it
- Markers are included in the saved plot image – perfect for reports
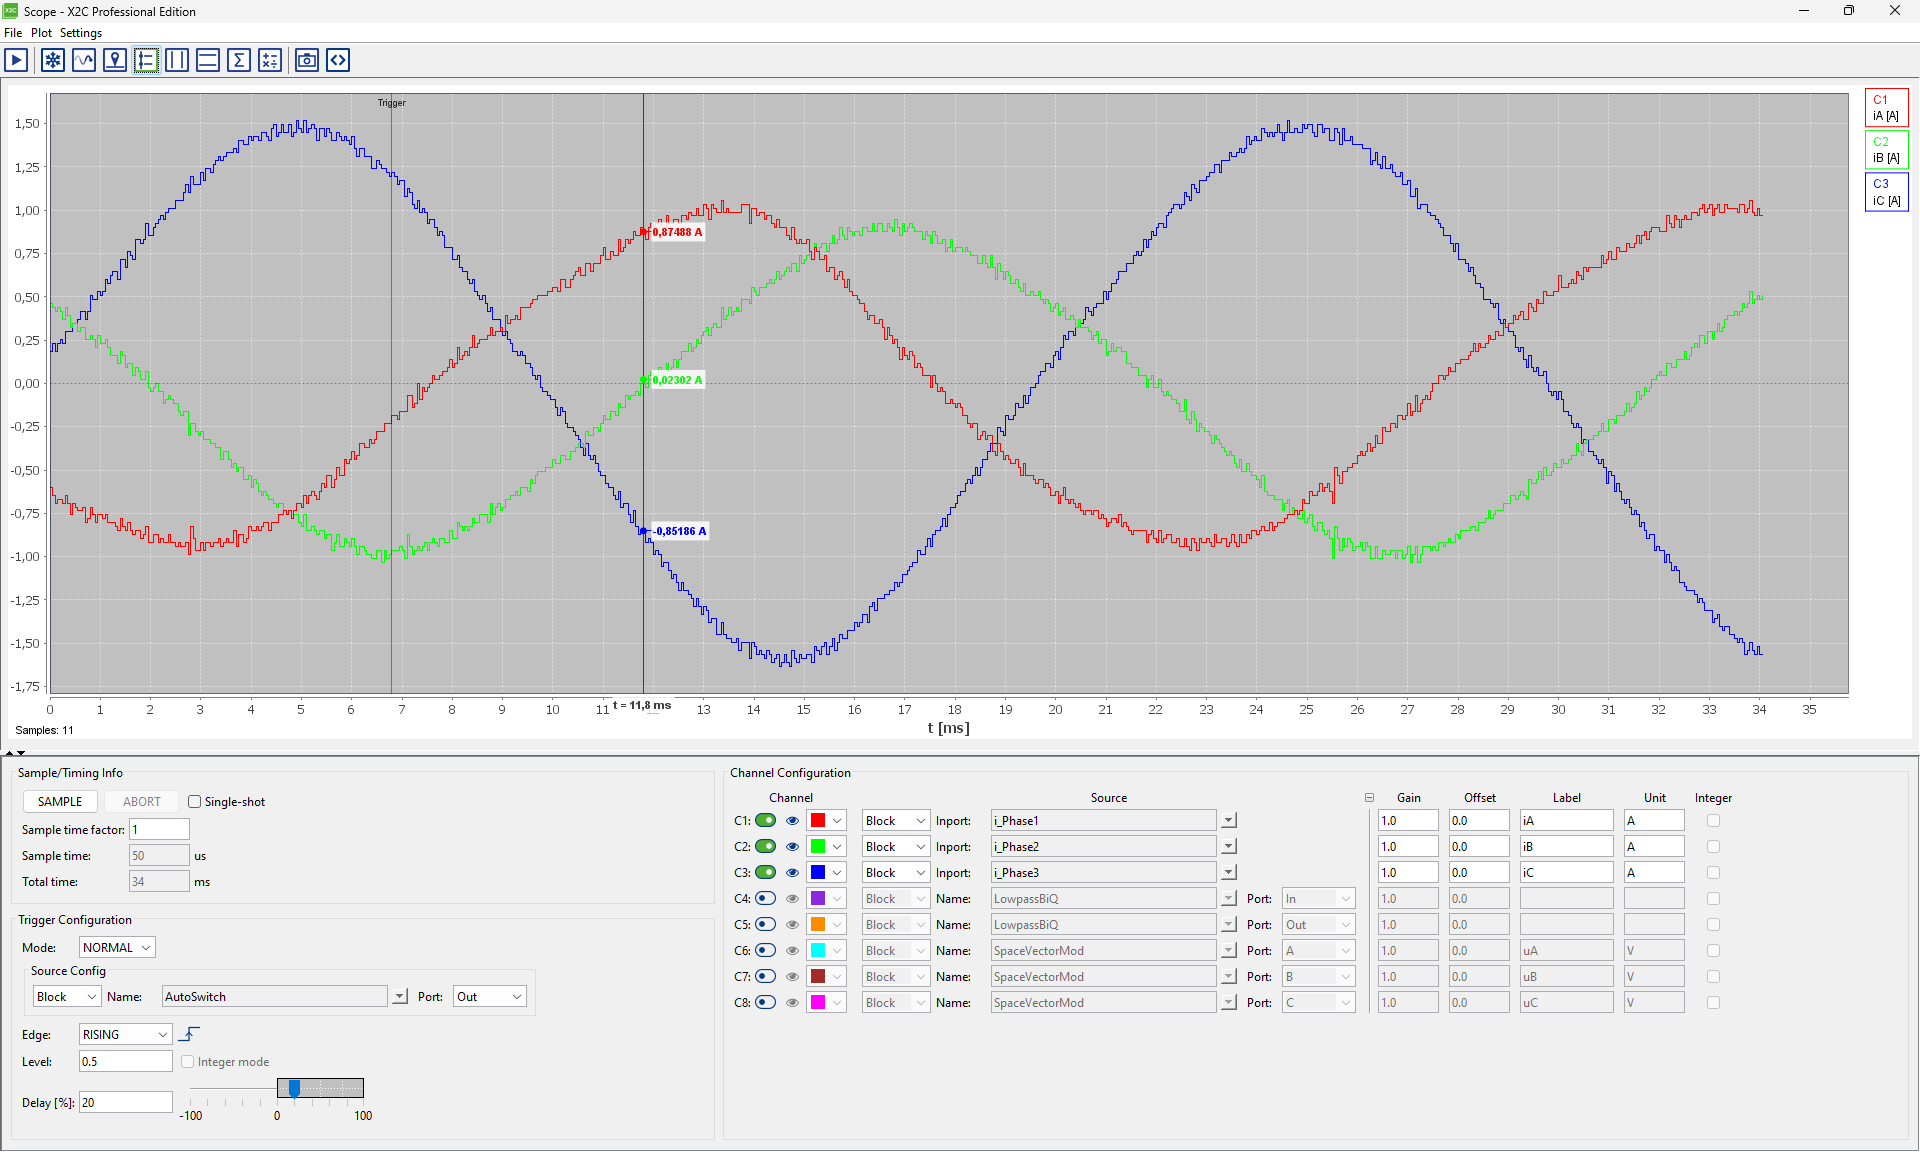
Multi Cursor
Move the mouse along the time axis and the multi cursor reads out every visible channel at that instant – no more guessing where two traces really cross.
- Follows the mouse in real time
- Values per channel in channel color, time on the x-axis
- Instantly check phase relations and sums of three-phase signals
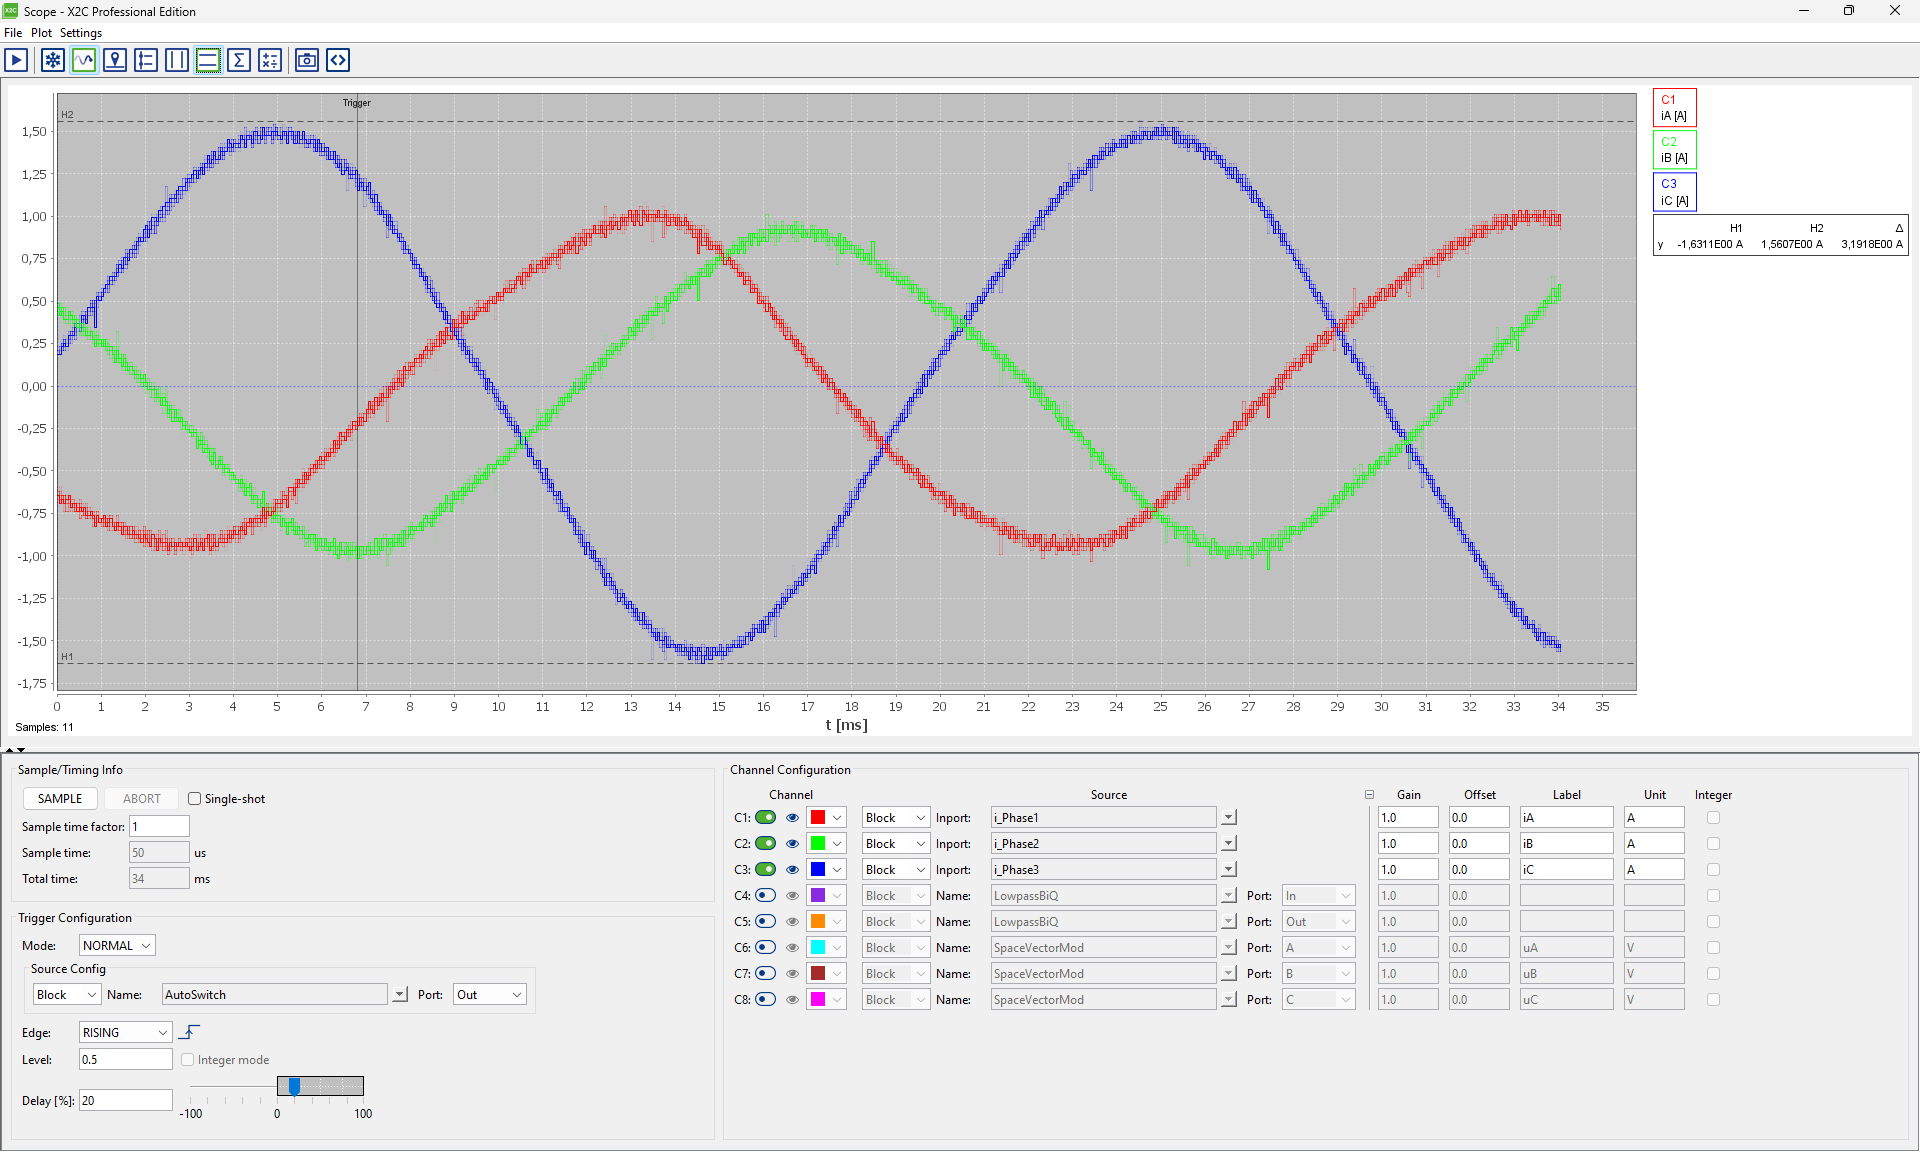
Horizontal & Vertical Cursors
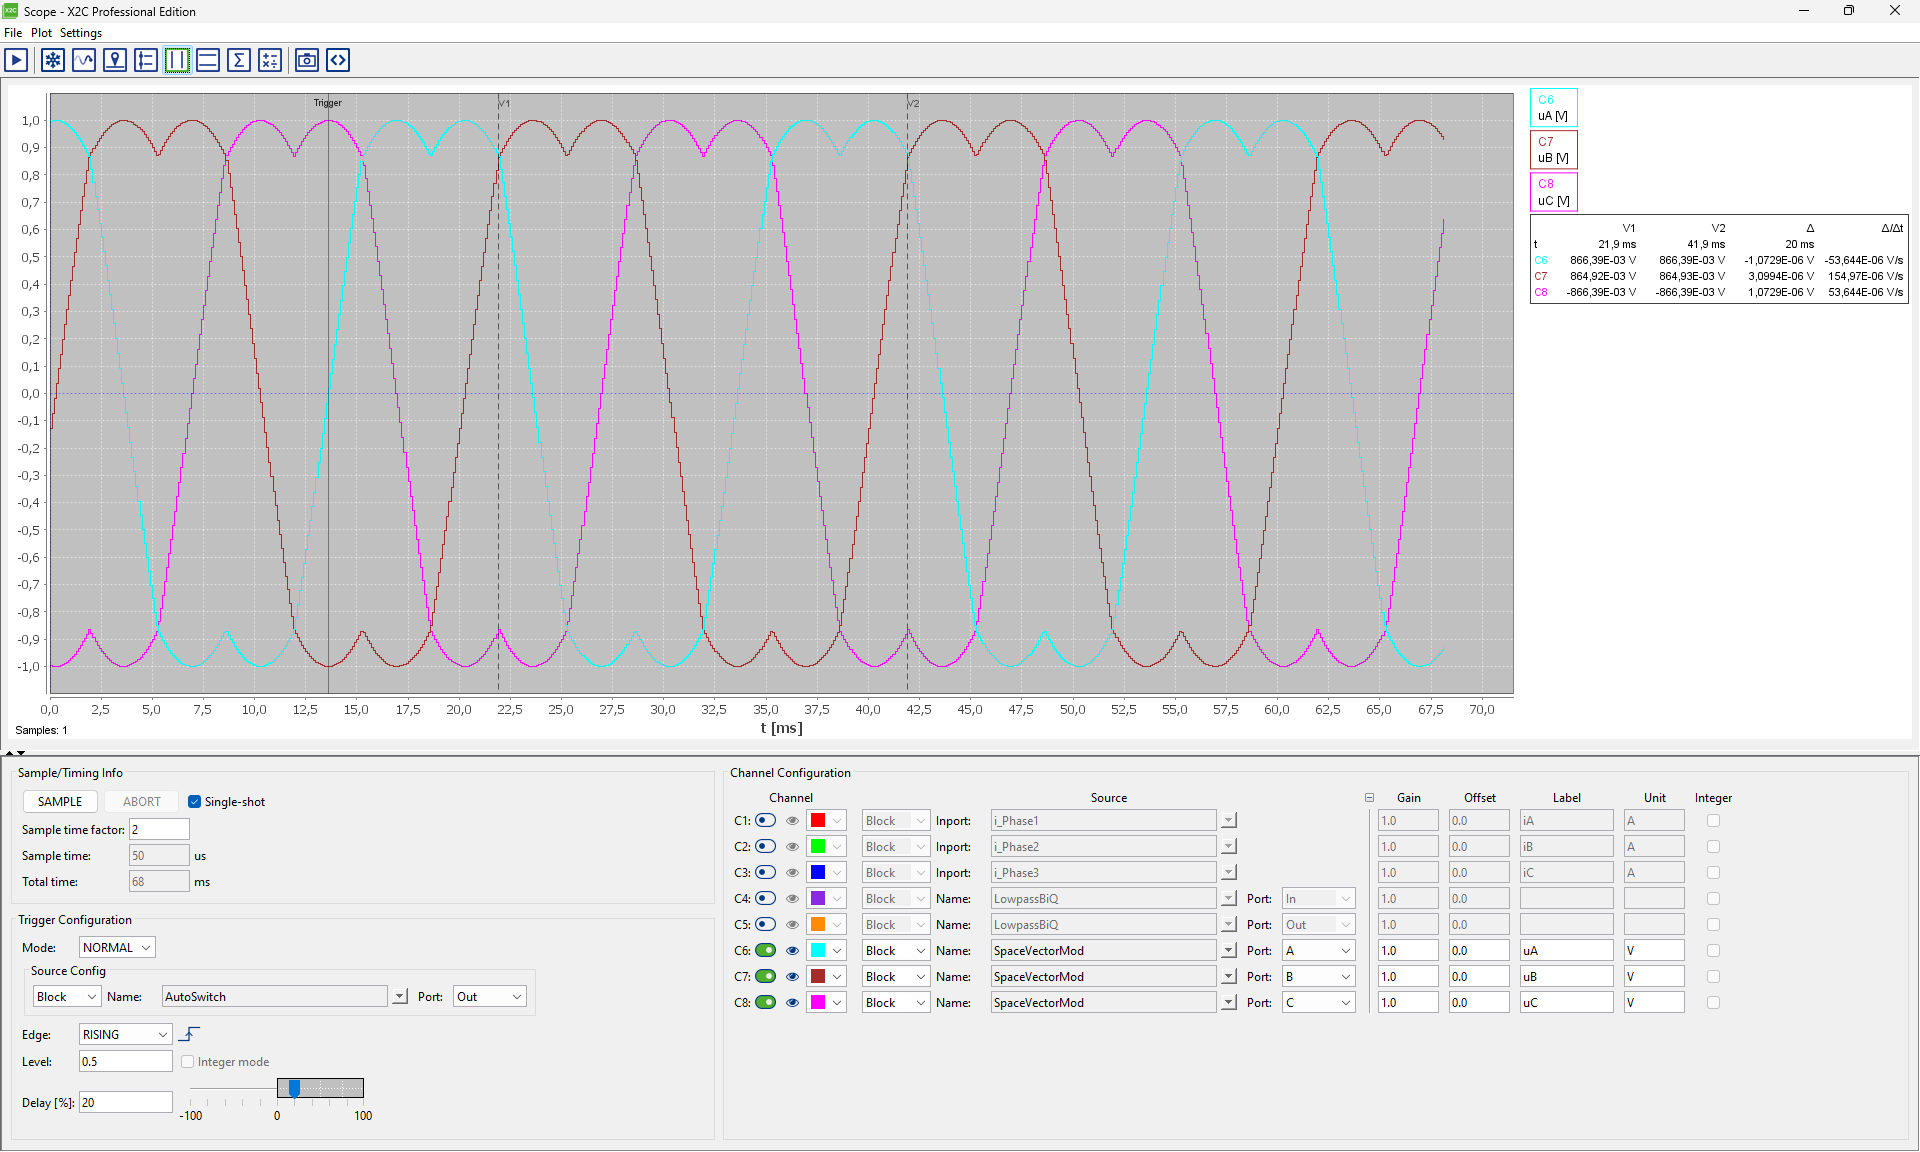
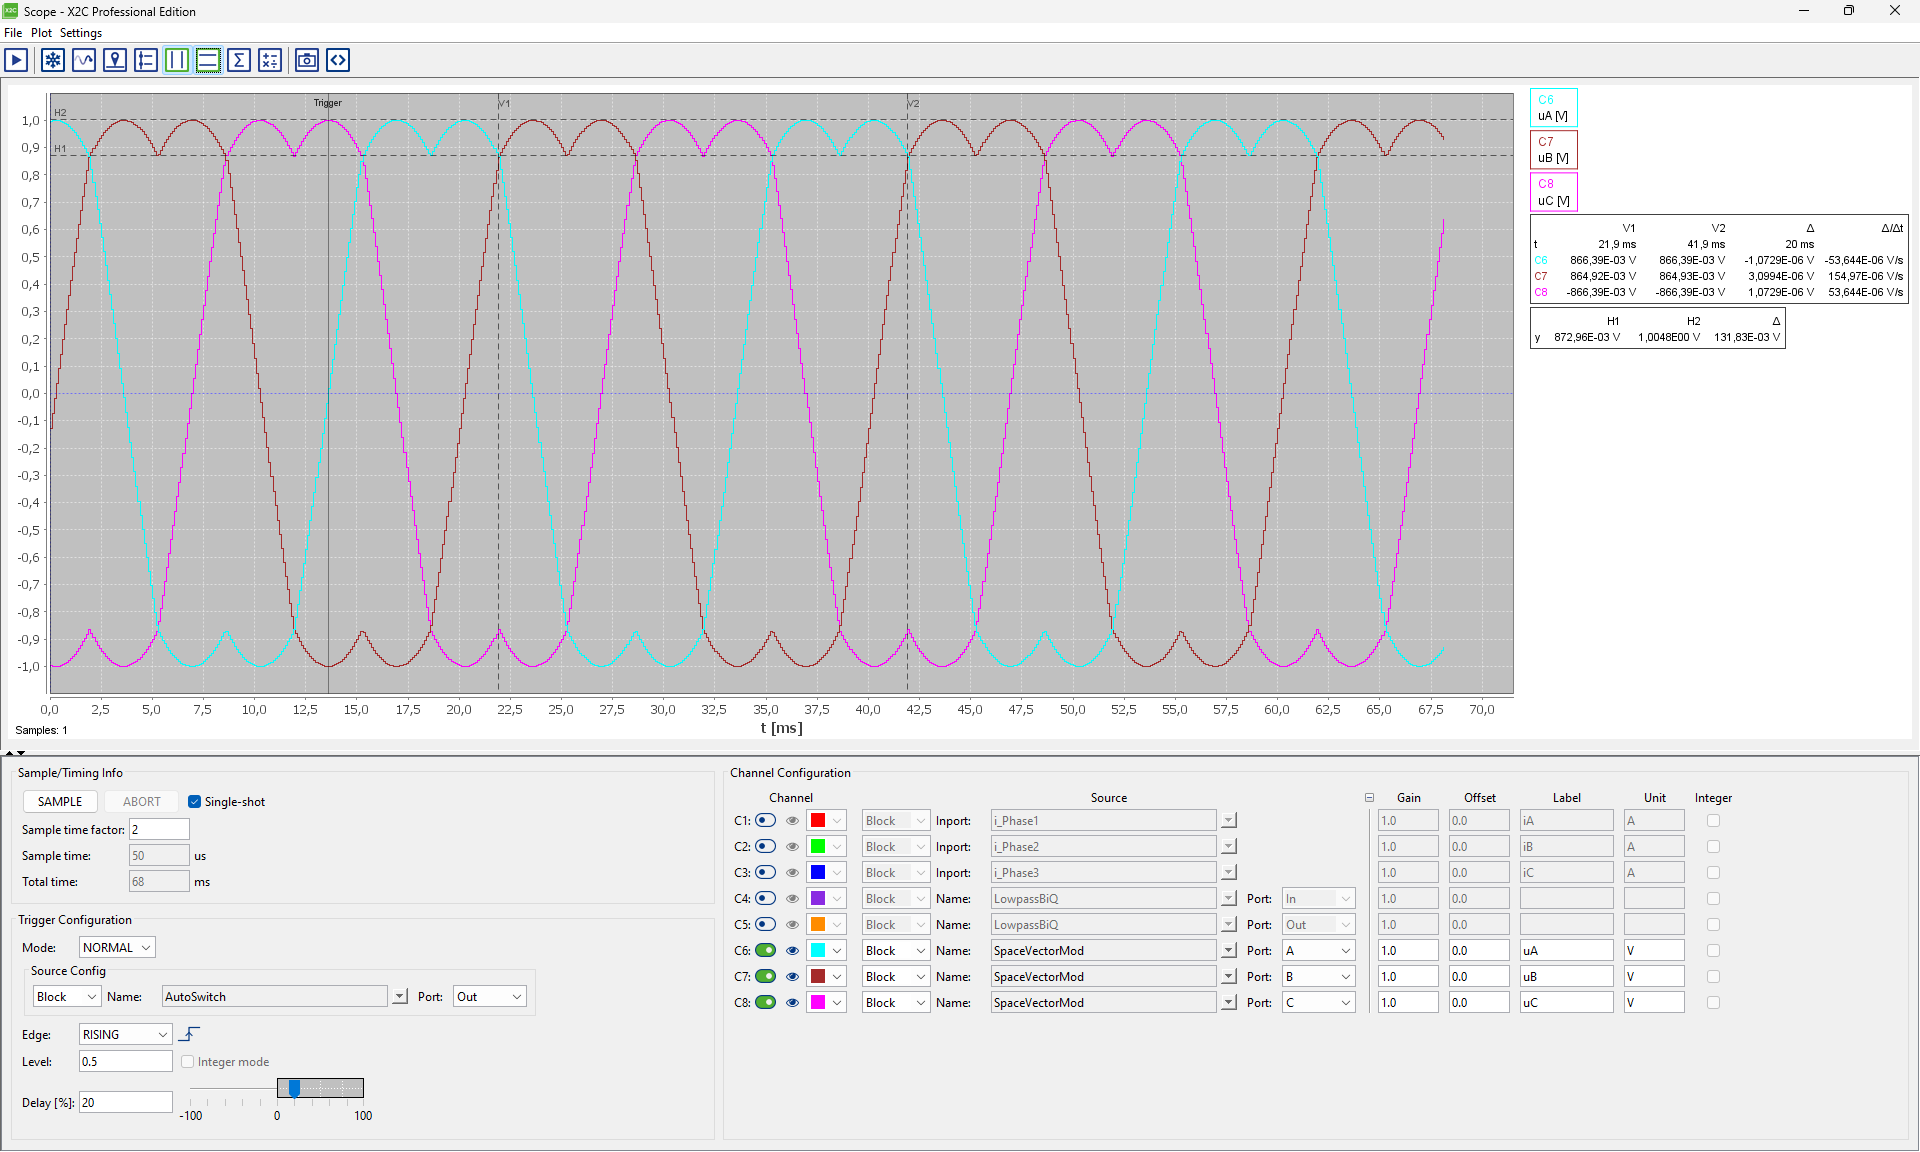
Two pairs of draggable cursors for precise measurements. The read-out table shows the values of both cursors plus the difference – for vertical cursors also the slope Δ/Δt of every channel. Combine both pairs for full 2-D measurements.
Measure
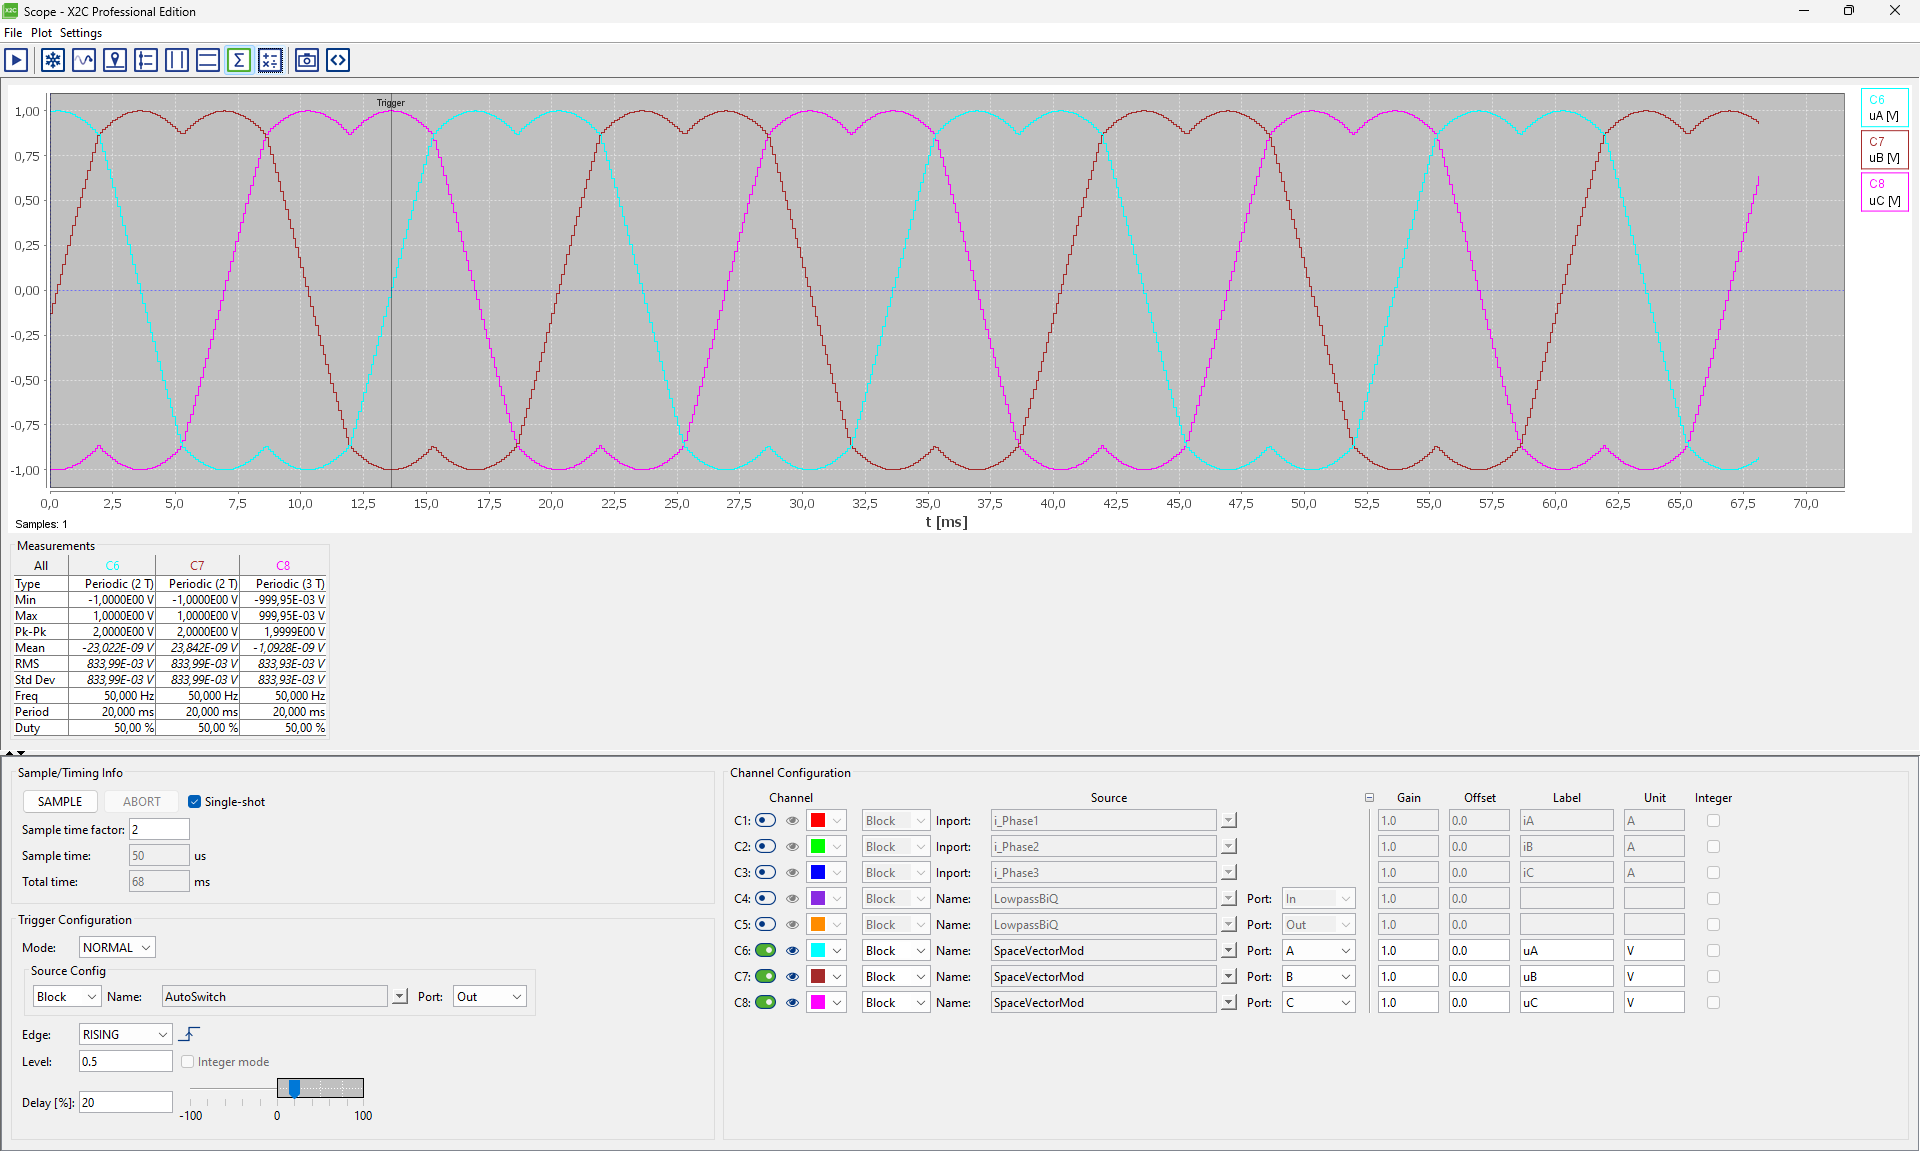
Get the key figures of all visible channels automatically, updated with every new data set. X2C Scope detects whether a signal is periodic and evaluates Mean, RMS, Std Dev, Frequency, Period and Duty over whole periods.
| Amplitude | Min · Max · Pk-Pk |
| Statistics | Mean · RMS · Std Dev |
| Timing | Freq · Period · Duty |
Choose which measurements to show via right-click on the Measure button.
Math Channels
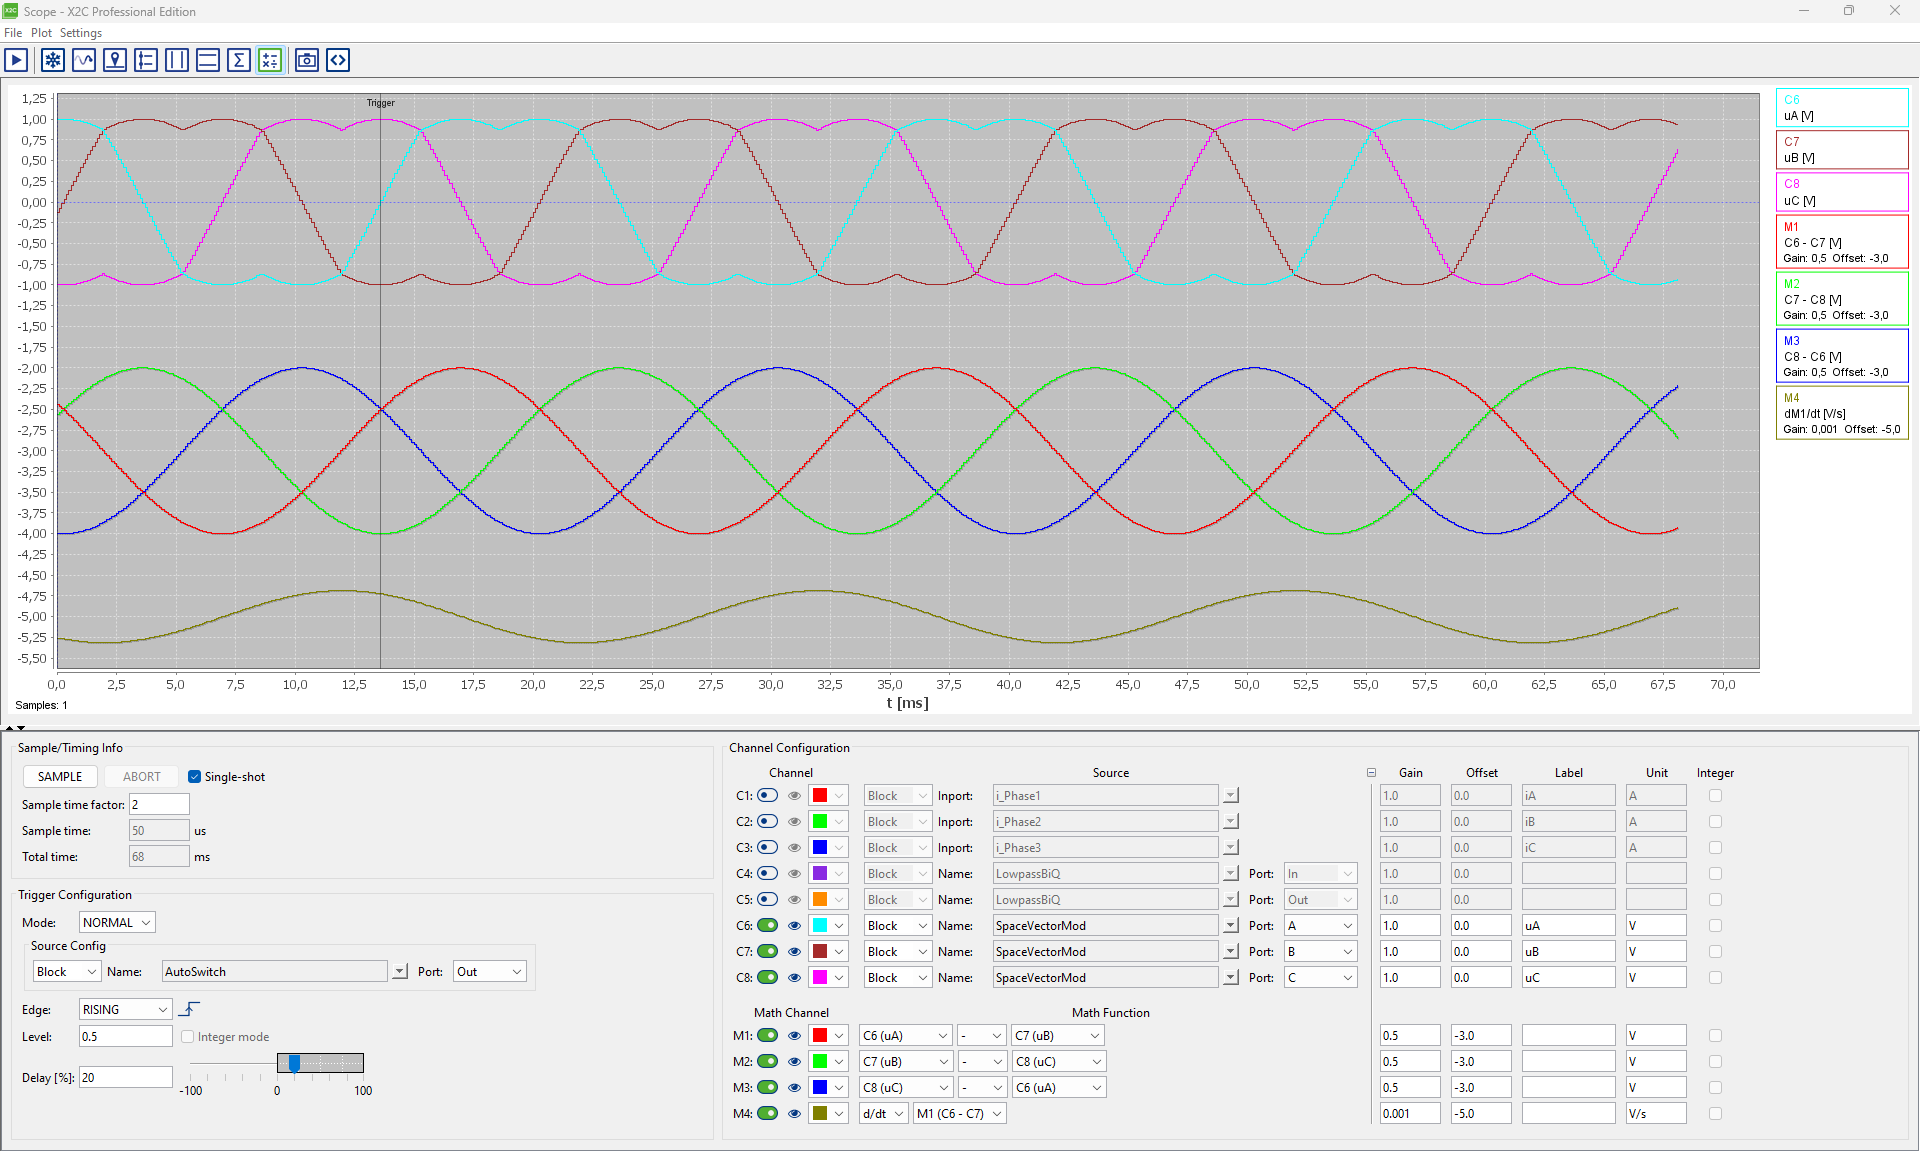
Four math channels M1–M4 derive new signals from the sampled ones – right inside the Scope, without touching your model or adding extra scope channels on the target.
- Own gain, offset, color and unit for every math channel
- Math channels can use other math channels – e.g. d/dt of a line voltage
- Example: line-to-line voltages uAB, uBC, uCA from phase voltages
Enhanced Plot Image & Data Export
Documentation made effortless. Both functions now work with a single click – no file dialog in between. Directory, base name and format are set once via right-click on the button or under Settings, and every file automatically gets a unique name.
Plot Image
- Formats: PNG, JPG, BMP
- What you see is what you get: markers, cursors and read-out panes are part of the image
- Take a whole series of images just by clicking repeatedly – nothing is ever overwritten
./Scope_20261014_101547.png
./Scope_20261014_101603.png
Data Export
- Write the sampled data as Matlab (.m) or Scilab (.sce) script
- Run the script and continue your analysis in your favorite tool
- File suffix: time stamp or running index – your choice
./Data_0002.m
./Data_0003.m
Want to know more?
The new Scope features ship with the next stable X2C release and are included in X2C Professional, Plus and Educational. Contact us to learn more.
Contact us